By Bonnie Aue
Introduction
We’ve all become accustomed to the sleek Power BI dashboards that offer real-time data visualization with filtering and drill-through capabilities. But have you considered the untapped potential of paginated reports and their role in automated reporting? In this blog post, we’ll explore the power of paginated reports and how they can revolutionize your reporting processes.
What is a Paginated Report?
According to Microsoft, paginated reports are specifically designed for printing or sharing. The name “paginated” comes from their ability to fit neatly on a page, displaying data in tables that can span multiple pages. These reports offer precise control over the layout, making them ideal for generating pixel-perfect PDFs. Think of bank statements or a stack of invoices—paginated reports provide an effortless way to generate accurate PDFs without the hassle of manual data extraction. Far from a dying technology, paginated reports remain an essential tool for meeting businesses’ unique reporting needs.
Keeping Everyone on the Same Page
While real-time data viewing is undoubtedly useful, there are instances when having a report generated at a specific time can be invaluable. Ever experienced conflicting data interpretations or the classic “refresh your page” scenario? Paginated reports offer a source of truth—a snapshot in time that enables everyone to align their discussions based on the same information.
Set and Forget
Combining paginated reports with automated workflows allows you to create reports and schedule them to be sent to specific email recipients at regular intervals: monthly, weekly, or even daily. This means you can receive well-formatted, customized reports in PDF format directly to your inbox, precisely when you need them.
Ensuring Data Quality Deadlines
By automating the workflow and publishing reports on a fixed schedule each month, you establish firm deadlines for teams to ensure their inputs are up-to-date. No more “I’ll update that later” excuses—automated reporting sets a standard for data quality and keeps everyone accountable.
Capturing Snapshots
Regularly scheduled reports enable you to capture snapshots of your data at various points in time. While Power BI dashboards are great, they may not retain historical progress data once it’s updated in other systems, like a custom field in a SharePoint list. With a monthly finance report sent on the 1st of each month, you can track the progression of your numbers throughout the calendar or financial year without storing an excessive amount of data.
Focused Meetings for Actionable Insights
Sharing the same document among your team can foster important conversations and drive increased visibility. When teams access the same data through automated reporting, discussions become more targeted and productive. Paginated reports play a crucial role in this process, as they are not restricted to a one-page dashboard. Instead, they can contain rows of detailed data that provide a comprehensive understanding of what makes up a metric. This depth of information enables teams to ask relevant questions, make data-driven decisions, and act based on accurate information. By leveraging paginated reports’ ability to present detailed data, teams can align their efforts, identify opportunities, and strategize for common goals, fostering collaboration and maximizing the impact of shared visibility.
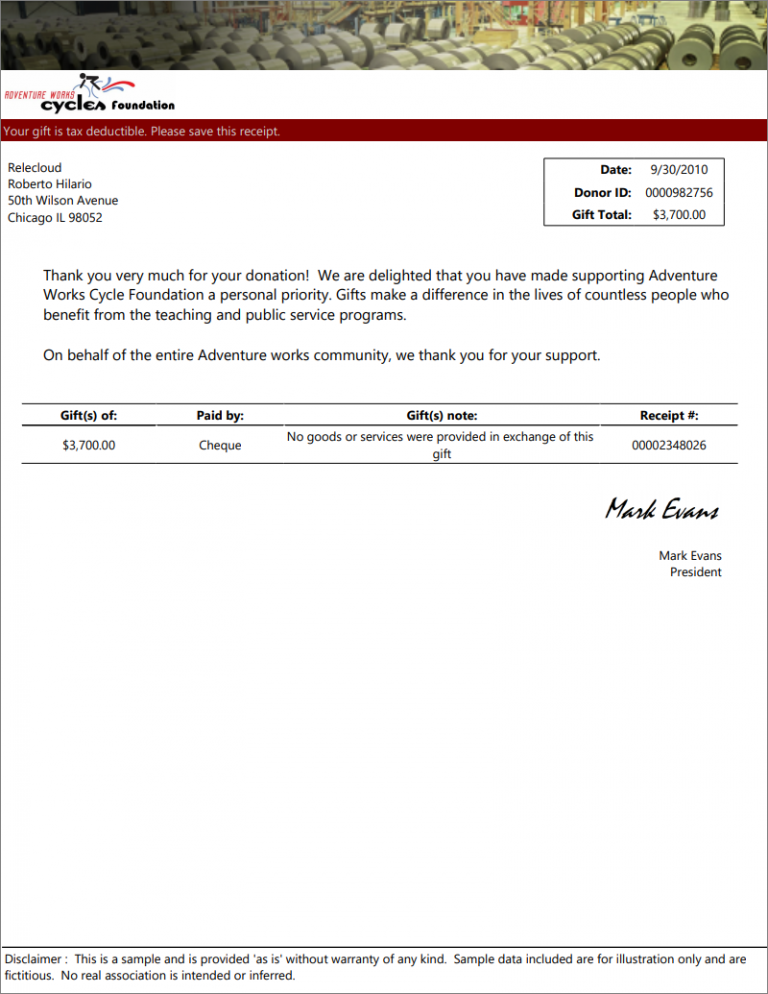
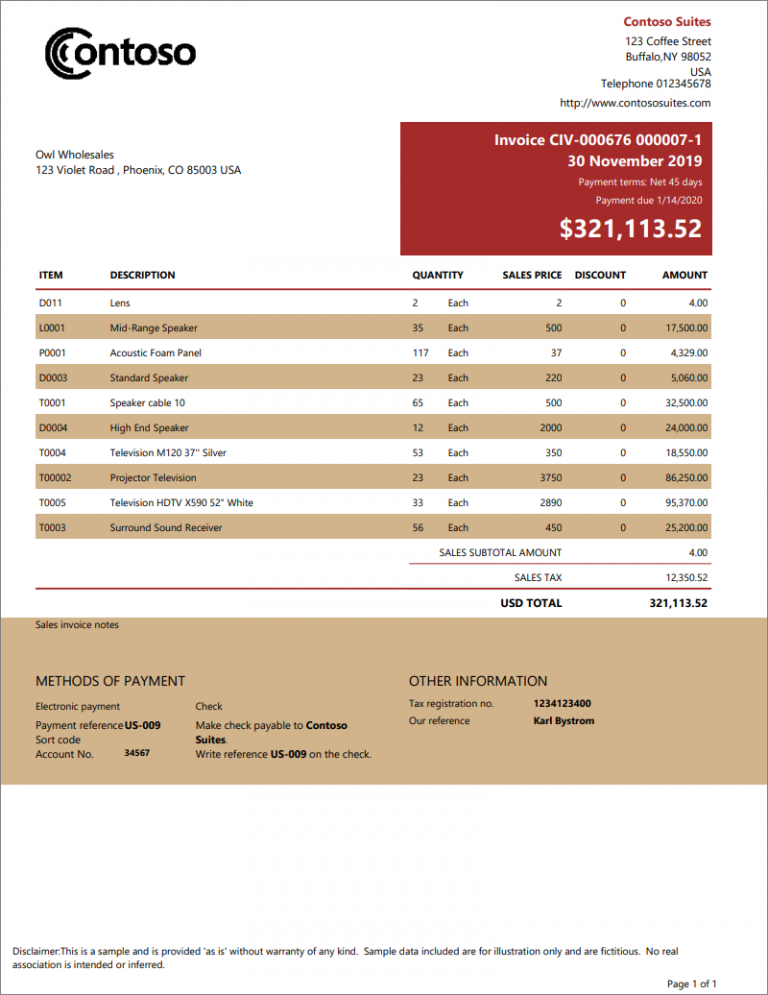
Some examples of paginated reports:
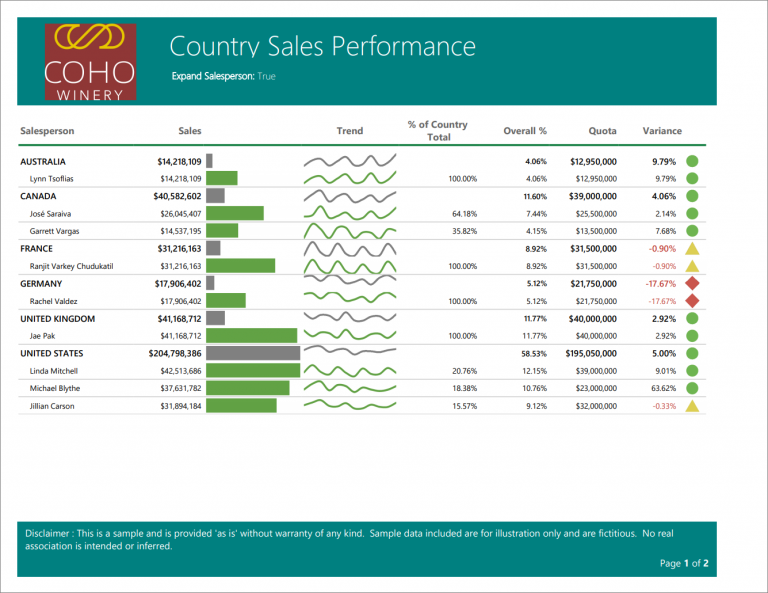
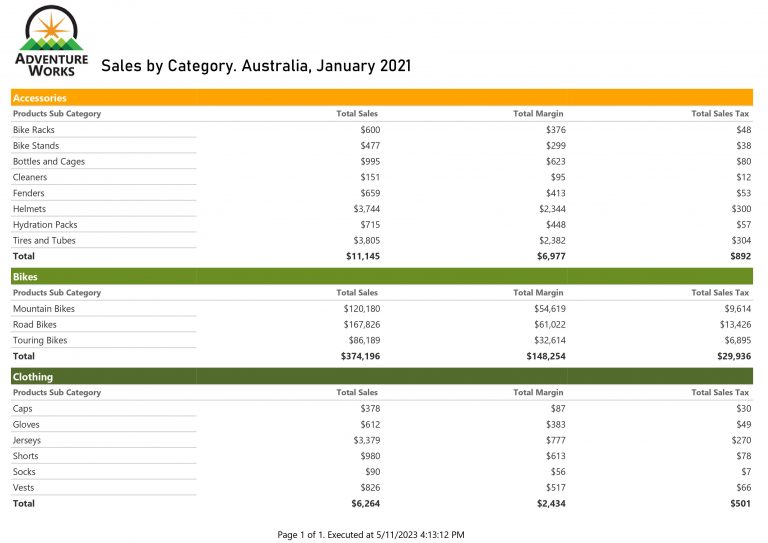
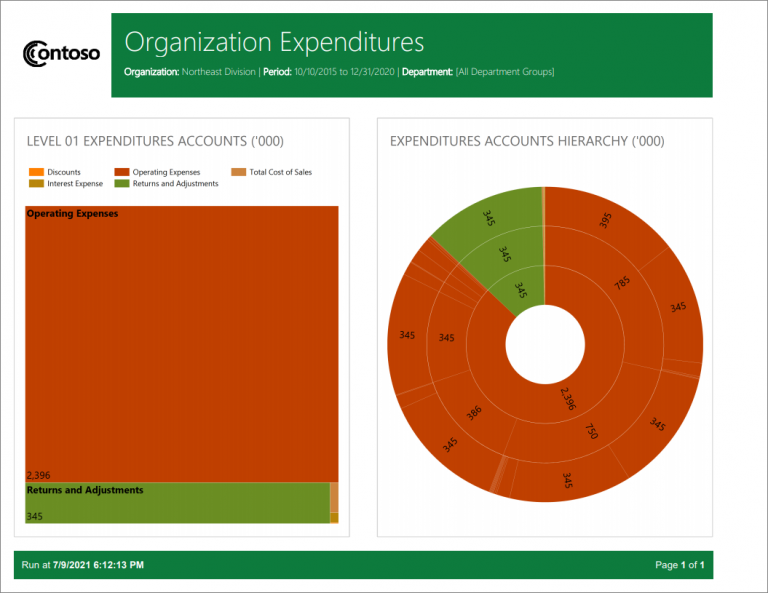
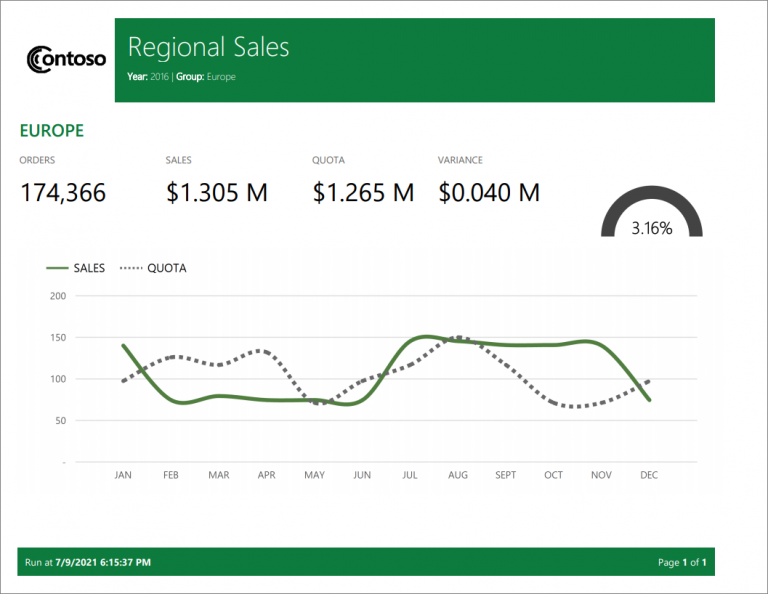
Paginated reports balance functionality and aesthetics, offering a sleek and visually appealing presentation for comprehensive data display. Scroll to the bottom to see some examples!
- Sales Performance Report: A detailed report showcasing sales performance metrics for each region and product category.
- Financial Analysis Report: A comprehensive report displaying financial statements, balance sheets, and income statements for a given period.
- Project Progress Report: A report tracking the progress of various projects, including milestones, timelines, and resource allocation.
Streamlined Data with Filters
Paginated reports allow you to apply filters, enabling you to view only the relevant information while excluding unnecessary details. This ensures that you focus on the data that truly matters.
Dynamic Parameters
In paginated reports, you can set parameters to build the same report, but each time with different data. For instance, if you’re a national company and need separate reports for each state or territory, a “State Parameter” can be configured to generate individualized reports for each region. Similarly, you can set up a parameter that sets a team for specific teams to track their project progress effectively.
Conclusion
Automated reporting offers endless possibilities, but knowing where to start can be challenging. At Data Sagacity, we specialize in helping companies navigate their data, uncover valuable insights, and take care of all the technical aspects behind the scenes. Speak with one of our expert consultants today and unlock the full potential of automated reporting for your company!
Remember, with Data Sagacity, you can focus on doing your best work while maximizing information and transparency. Let’s revolutionize your reporting together!
Gallery:
Share this post with your network!


